Raise your Quality Score keyword by keyword and stop overpaying for every click
The Quality Score in Google Ads directly shapes what you pay for every click and where your ads appear. The trouble is that Google shows it as a single number from 1 to 10 β no context, no history and not a word about what to do to raise it. Quality Score Analyzer turns that number into a complete diagnosis-and-action system.
The script analyses every one of your Search campaigns, breaks the QS down into its three real components (Expected CTR, Ad Relevance and Landing Page Experience), measures your account's coverage (what share of your traffic comes from keywords with a healthy QS) and builds a spreadsheet full of actionable tabs: keywords with a critical QS ready to pause, ad groups to review, suggested keywords and negatives, change alerts and cannibalisation detection.
Why it matters. A keyword with a QS of 3 can cost you up to four times more per click than the same keyword with a QS of 8. Finding the keywords dragging your account down and acting on them is one of the most profitable levers in Google Ads. Quality Score Analyzer tells you exactly which ones they are and what to do with each of them, every day.
The script builds a Google Sheet with a Dashboard, charts and actionable tables. This is what you get:
| Component | Score | Interpretation |
|---|---|---|
| Ad Relevance | 9.60 / 10 | β Above average |
| Expected CTR | 8.79 / 10 | β Above average |
| Landing Page Experience | 3.34 / 10 | β Below average β improve |
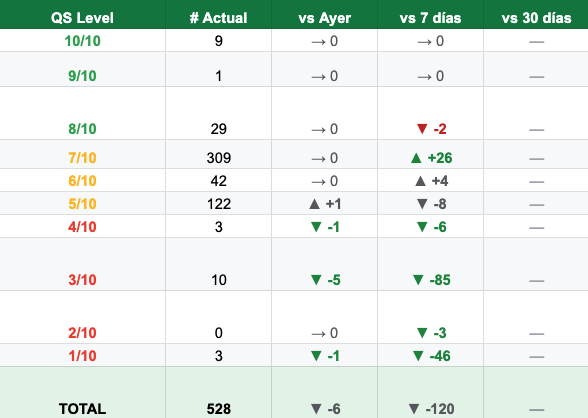
| QS Level | # Current | vs Yesterday | vs 7 days | vs 30 days |
|---|---|---|---|---|
| 10/10 | 9 | β 0 | β 0 | β |
| 9/10 | 1 | β 0 | β 0 | β |
| 8/10 | 29 | β 0 | βΌ -2 | β |
| 7/10 | 309 | β 0 | β² +26 | β |
| 6/10 | 42 | β 0 | β² +4 | β |
| 5/10 | 122 | β² +1 | βΌ -8 | β |
| 4/10 | 3 | βΌ -1 | βΌ -6 | β |
| 3/10 | 10 | βΌ -5 | βΌ -85 | β |
| 2/10 | 0 | β 0 | βΌ -3 | β |
| 1/10 | 3 | βΌ -1 | βΌ -46 | β |
| TOTAL | 528 | βΌ -6 | βΌ -120 | β |
It breaks your Quality Score apart and measures what really moves your cost per click
The first component of the Quality Score. The script pulls it keyword by keyword, weighted by impressions, and charts it day by day so you can see whether your ads earn the clicks Google expects.
How closely your ad matches the search intent behind each keyword. It is the component you can improve fastest, simply by rewriting headlines and descriptions.
The third component: how good and how relevant your landing page is. The script isolates it so you know whether the problem sits in the ad or in the page you are sending traffic to.
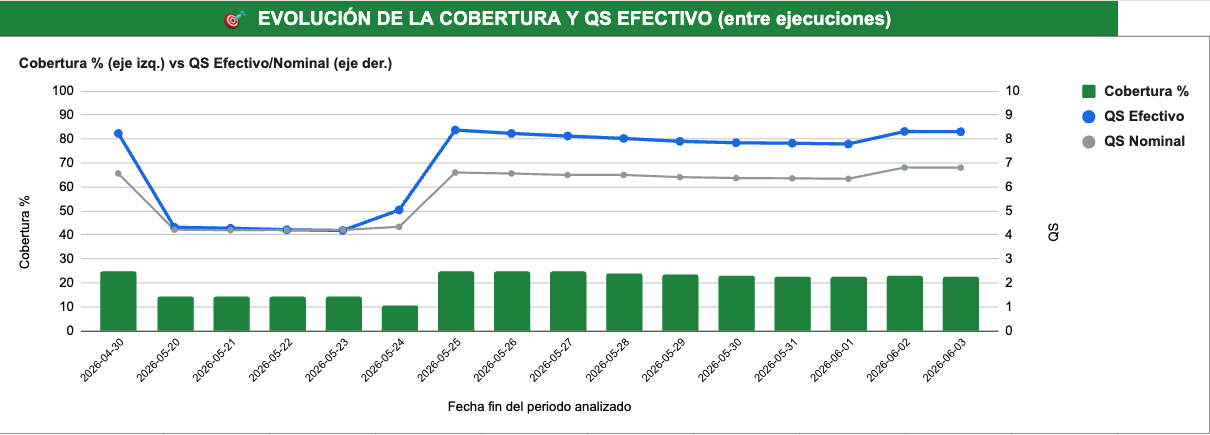
The headline indicator: what share of your clicks and impressions comes from keywords with a healthy Quality Score. A traffic-light Dashboard tells you at a glance whether your account is fit or bleeding money.
It finds the keywords with a very low QS and enough impressions β the ones dragging the account's effective QS down hardest. You get them sorted by impact and ready to pause with one tick in the sheet.
It spots when one search term triggers several different keywords that end up competing with each other, splitting the data and dragging everyone's QS down. The script flags it so you can fix it.
An overview tab with traffic-light colours (green / amber / red) for effective QS, coverage and components. Five seconds and you know how the account is doing, without reading a single table.
It keeps a history of the Quality Score and its three components and draws daily and monthly charts. At last you can see whether your changes lift the QS or not, instead of guessing.
It picks out the ad groups and keywords with the worst QS performance and hands them to you in tabs with tick boxes, so you act straight from the sheet. Paused keywords are labelled automatically in Google Ads.
It goes beyond diagnosis: it proposes new keywords worth adding and negatives worth excluding, to clean up the traffic and sharpen the relevance of each ad group.
It notices when a keyword's Quality Score moves meaningfully between runs and tells you, with de-duplication so you never get the same alert about the same item twice.
Dedicated tabs for the keywords whose QS improves most (Winners) and those that fall furthest (Losers), so you can spot the pattern and repeat what works.
One tab that gathers every recommended action, ordered by impact, so you know where to start without hopping between tables.
An automatic summary of how your Quality Score stands and what is still pending. Daily whenever there is something to report, weekly on Mondays and monthly on the 1st, all in a single email.
In large accounts that will not fit in a single run (Google Ads caps scripts at 30 minutes), the script saves its progress and resumes the analysis on the next run without losing any data.
Everything you need to master the script from day one
So you understand exactly how it works.
For the questions that cannot wait until tomorrow.
Strategy, not just diagnosis: we do not simply teach you to read the Quality Score. We help you work out which component is failing in each case and exactly what to change in your ads, keywords and landing pages to raise it and bring your cost per click down.
A full diagnosis, prioritised actions and daily tracking of your Quality Score.
See pricingYou no longer need to link your account to any manager account (MCC) or give anyone access: you log in to your client panel, download the script loader and paste it into your own Google Ads account. Done. Zero friction β and you keep full control of who can see your account.